





















Telecommunications executives today are faced with an overwhelming volume of data from every part of their business, from network performance metrics to financial reports and customer feedback. While this information is essential for making informed decisions, the sheer scale and complexity of raw telecom datasets can often make it difficult to identify the most important trends and patterns. Without the right tools to interpret this data, leaders may struggle to gain a clear understanding of the business, leading to delayed reactions to market shifts and missed opportunities for growth. The use of big data visualization is critical for transforming this raw telemetry into clear and actionable strategic insights that can guide the organization toward its goals.
Big data visualization goes beyond simple charts and graphs to provide a more intuitive and interactive way to explore complex information. By using advanced techniques such as heat maps, network diagrams, and geographic overlays, executives can gain a more holistic view of their operations. For example, a map-based visualization of 5G network performance can quickly reveal areas of congestion or poor signal quality that may be impacting customer satisfaction. This visual approach to data analysis allows for a much faster identification of issues and opportunities, enabling more responsive and effective leadership in a fast-moving industry.
Additionally, the process of designing visualizations forces the organization to clarify its most important key performance indicators and to align them with its broader strategic objectives. This ensures that the information being presented to executives is not only accurate but also highly relevant to the decisions they need to make. By focusing on the most critical metrics, big data visualization helps to reduce the noise and complexity of the telecom environment, providing a single source of truth that can be used to build consensus across the leadership team. In this way, visualization acts as a powerful bridge between technical data and business strategy, empowering executives to lead with confidence in the digital age.
Designing Interactive Dashboards for Telecom Leadership
The effectiveness of big data visualization for executive decision support depends on the design of interactive dashboards that provide the right level of detail for a diverse audience. A well-designed dashboard should allow a CEO to see the high-level health of the business at a glance, while also providing the ability to drill down into specific regions, departments, or service lines for more detailed analysis. This flexibility is essential for accommodating the different needs and perspectives of the leadership team, ensuring that everyone has access to the insights they need to do their jobs effectively.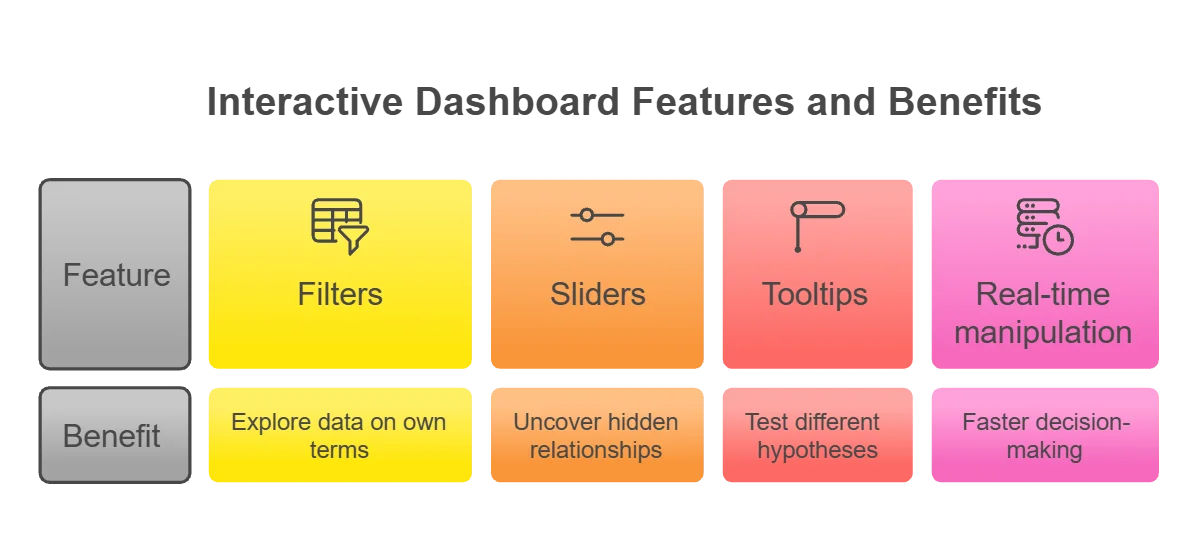
Interactive features, such as filters, sliders, and tooltips, allow executives to explore the data on their own terms and to uncover hidden relationships that may not be apparent in a static report. For instance, an executive might use a dashboard to investigate the correlation between network upgrade investments and subscriber growth in a specific city. By being able to manipulate the data in real time, leaders can test different hypotheses and gain a deeper understanding of the drivers of business performance. This self-service capability is a major driver of agility and innovation, as it allows for faster decision-making without the need for constant support from the data engineering team.
In addition to technical functionality, the visual design of the dashboard is also critical for its success. The use of clear layouts, consistent color schemes, and intuitive icons helps to ensure that the information is easy to understand and interpret. This is particularly important for busy executives who may only have a few minutes to review the data before a meeting or a strategic decision. A poorly designed dashboard can be confusing and misleading, undermining the trust that leaders have in the data. By following best practices for data visualization design, telecom operators can create a more effective and engaging experience for their leadership team, leading to better decision-making and stronger business outcomes.
Visualizing 5G Rollout Progress and ROI Metrics
The massive investment required for the rollout of 5G networks is one of the most significant strategic challenges facing telecommunications operators today. Executives need clear visibility into the progress of these infrastructure projects and the return on investment they are generating. Big data visualization provides a powerful way to track these metrics in real time, allowing leaders to see how the network is being built and how it is performing in terms of subscriber adoption and revenue growth. By visualizing the 5G rollout on a map, operators can identify areas where deployments are ahead of schedule and where they are falling behind, allowing for more effective resource allocation.
ROI metrics can also be visualized to provide a clearer picture of the financial impact of 5G. This includes tracking the growth in high-value data plans, the adoption of new digital services, and the reduction in operational costs achieved through network modernization. By presenting these metrics in a visual format, the organization can more effectively demonstrate the value of its infrastructure investments to shareholders and other stakeholders. This transparency is essential for building trust and for securing the continued investment needed for the long-term success of the 5G program.
Beyond this, big data visualization can be used to compare the performance of different 5G vendors and technologies. By visualizing key metrics such as signal quality, throughput, and power consumption across different network segments, operators can identify the most effective and efficient solutions for their specific needs. This data-driven approach to vendor management ensures that the organization is getting the best possible value from its hardware and software partners. The ability to see and compare these technical metrics in a business context is a major advantage for telecom executives who are responsible for managing complex and multi-vendor network environments.
Mapping Market Trends and Competitive Intelligence
In addition to internal metrics, telecom executives also need to stay informed about broader market trends and the activities of their competitors. Big data visualization can be used to map this external environment, providing insights into changes in consumer behavior, emerging technologies, and the competitive landscape in different regions. By visualizing data from social media, industry reports, and regulatory filings, operators can gain a more comprehensive understanding of the opportunities and threats facing their business. This external visibility is essential for developing a more resilient and forward-looking corporate strategy.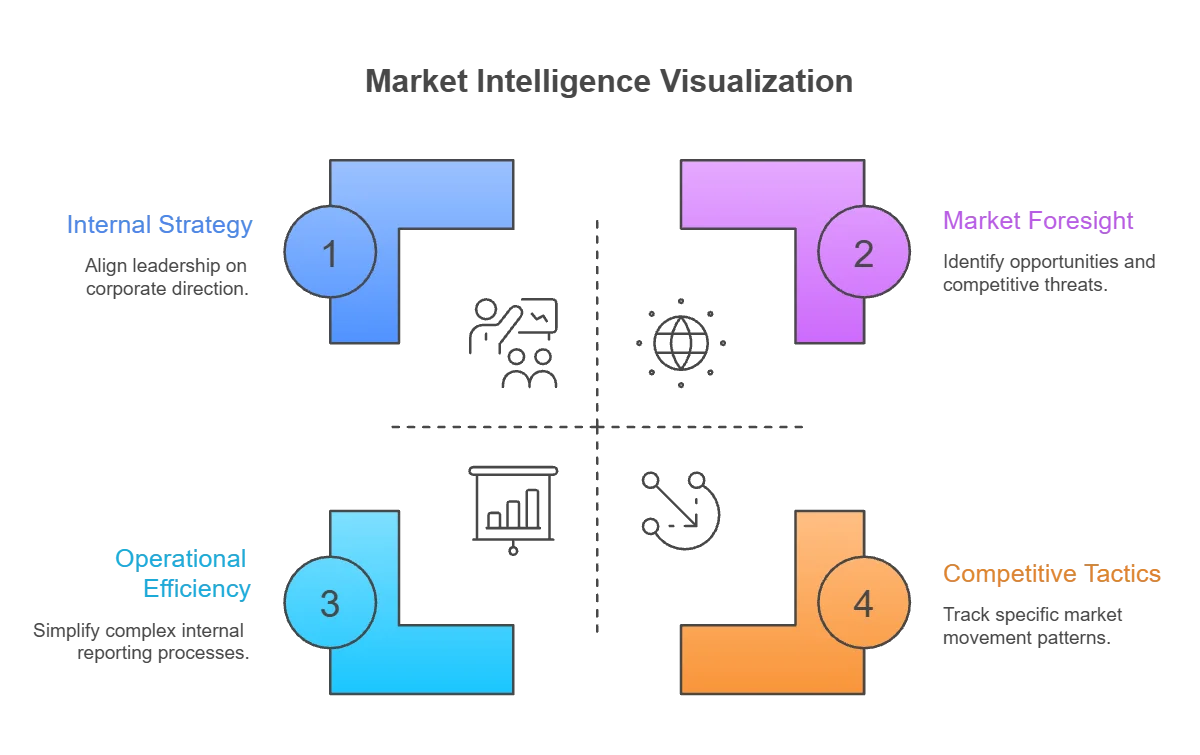
For example, visualization can be used to track the movement of subscribers between different operators, revealing patterns of churn and the effectiveness of competitor marketing campaigns. This information allows for a more proactive response to market shifts, such as the launch of a new retention offer or a targeted advertising campaign in a specific area. Additionally, mapping the deployment of fiber and 5G by competitors can help an operator to identify “white spaces” where they can gain a first-mover advantage. By combining these external insights with internal performance data, executives can build a more holistic and effective view of their market position.
The use of big data visualization also simplifies the communication of complex market intelligence to the broader organization. Instead of lengthy reports that may be ignored or misunderstood, visual summaries can be easily shared and discussed in strategic planning meetings. This ensures that the entire leadership team is aligned on the most important market trends and that the organization is moving in a consistent direction. By fostering a more data-driven and visually-oriented culture, communications service providers can improve their ability to adapt to a rapidly changing and highly competitive global market.
Integrating Qualitative Feedback with Quantitative Metrics
While quantitative metrics are essential for managing a telecommunications business, qualitative feedback from customers and employees provides critical context that is often missing from traditional reports. Big data visualization can be used to integrate these different types of information, providing a more balanced and nuanced view of the business. For instance, sentiment analysis of customer support logs and social media posts can be visualized alongside traditional network performance data to show how technical issues are impacting brand reputation and customer satisfaction.
Visualizing qualitative data requires the use of specialized techniques such as word clouds and sentiment heat maps. These tools can help executives to quickly identify the most common themes and emotions in customer feedback, allowing for a more human-centric approach to decision-making. By seeing that a specific network issue is causing a significant spike in negative sentiment, a leader can prioritize its resolution more effectively than if they were only looking at technical telemetry. This integration of quantitative and qualitative insights is essential for building a more customer-focused and responsive telecom organization.
Finally, the use of big data visualization for executive support is part of a broader shift toward data-driven leadership in the telecommunications industry. As the complexity and volume of data continue to grow, the ability to interpret and communicate that information effectively is becoming a core competency for any executive. By investing in the tools and skills needed for visualization, operators are also investing in the quality and speed of their strategic decision-making. In a world defined by data, the leaders who can see the future most clearly are the ones who will be most successful in shaping it.